
Public betting percentages are defined as the share of total wagers and total money placed on each side of a sports betting market. These numbers appear in two distinct forms: the percentage of individual bets placed (bet volume) and the percentage of total money wagered (handle). Understanding both is the foundation of any serious betting trends analysis. Chalkpicks reports a verified 73.1% win rate and an average ROI of +18.4% over the past year, results built in part on reading these market signals correctly. Bettors who treat public wager statistics as raw data, rather than a complete answer, gain a measurable edge over those who rely on gut instinct alone.
What are public betting percentages and how do they work?
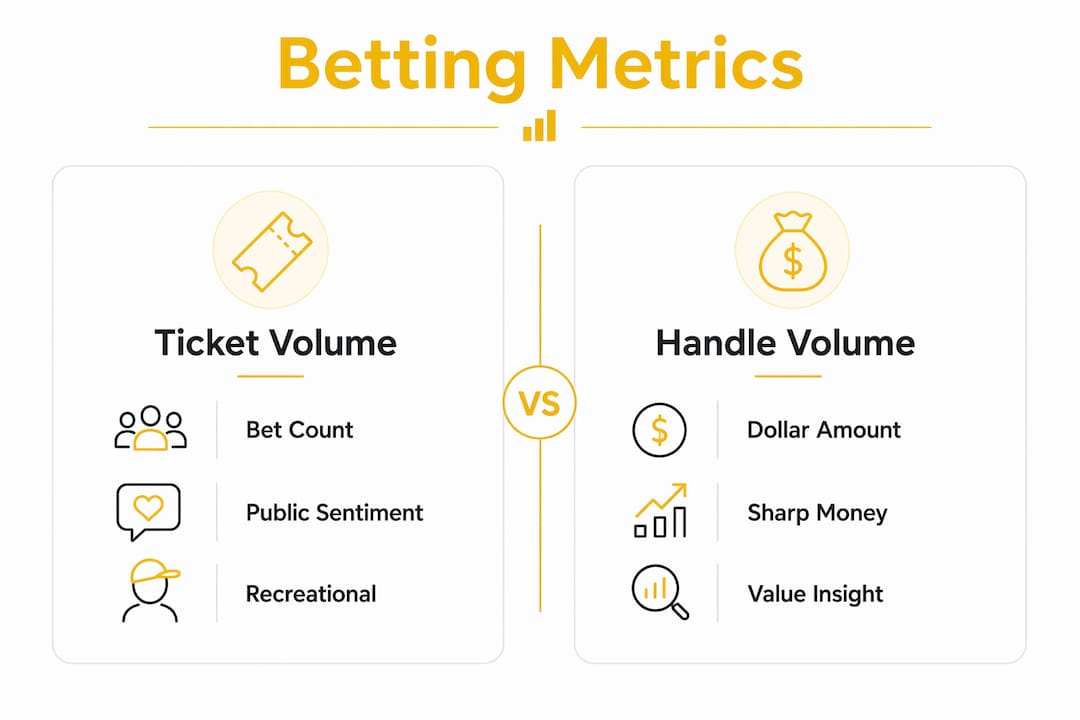
Public betting percentages measure how the betting market divides across two or more outcomes. Sportsbooks track two figures: "Bets %" reflects ticket volume, meaning the count of individual wagers, while "Handle %" shows the money-weighted share, meaning the total dollars placed on each side. These two numbers often tell different stories.
Bet volume counts every ticket equally. A $10 bet and a $10,000 bet each count as one ticket. Handle weights by dollar amount, so the $10,000 bet carries 1,000 times more influence. When these two figures diverge sharply, the market is sending a signal worth examining.

Sportsbooks use both figures to manage risk and set lines. A book that sees 70% of tickets on one side but only 50% of the handle knows that the other side is attracting larger, more deliberate wagers. That gap is where the most useful information lives.
What is the difference between bet volume and handle in public percentages?
Bet volume and handle are the two core metrics in any betting splits analysis, and confusing them is one of the most common errors bettors make. Bet volume reflects ticket count, regardless of wager size, while handle reflects total dollars, weighting larger bets more heavily.
The 2026 World Cup betting market illustrates this gap clearly. Spain accounted for 17% of betting tickets but 25.5% of total money wagered. That 8.5-point gap between ticket share and handle share signals that the bets placed on Spain were significantly larger on average than those placed on other teams. France showed a similar pattern, drawing 16% of bets but 21.5% of the handle.
| Metric | What it measures | What it reveals |
|---|---|---|
| Bets % (ticket volume) | Number of individual wagers | Public sentiment and fan-driven activity |
| Handle % (money share) | Total dollars wagered per side | Where larger, more deliberate money sits |
| Divergence (Handle minus Bets) | Gap between the two figures | Potential sharp money or professional influence |
Pro Tip: Always check both figures before drawing conclusions. A team with 65% of tickets but only 48% of the handle is drawing small, casual bets. The money is elsewhere, and that matters more.
How do sharp bettors and public bettors differ in betting patterns?
The distinction between sharp and recreational bettors shows up directly in public betting data. Recreational bettors place many small wagers on their favorite teams, inflating ticket volume. Sharp bettors place fewer, larger bets focused on expected value, which inflates handle without moving ticket counts much.
Altenar's World Cup data describes this as "heart versus head" betting. Fan-driven, or "heartbeat," bets contribute large numbers of tickets. Calculated, professional moves show up in handle figures and line shifts. Public bettors' volume is driven by emotional factors, while professional actions focus on maximizing expected value.
Characteristics that separate the two groups:
- Sharp bettors place large individual wagers, bet late in the market to capture maximum value, target lines they believe are mispriced, and cause handle percentages to shift without moving ticket counts proportionally.
- Public bettors place many small wagers, bet early and often on popular teams, favor home teams and favorites regardless of line value, and drive ticket volume without necessarily reflecting market efficiency.
Home team bias is a consistent pattern in public betting data. Recreational bettors back their local or favorite teams at rates that inflate ticket volume on those sides. Sharps identify this bias and often bet the opposite side when the line has not adjusted enough to account for it.
Pro Tip: When a heavily favored or popular team draws 75% or more of tickets but the line barely moves, that is a sign the book is comfortable with the exposure. The handle likely tells a different story.
What does divergence between public bet percentages and handle indicate?
Divergence between ticket volume and handle is one of the most informative signals in sports betting. Sportsbooks adjust lines opposite to public betting percentages when sharp bettors place large wagers, a phenomenon called reverse line movement. When the public heavily backs one side but the line moves toward that side rather than away from it, sharp money is almost certainly on the other side.
Reverse line movement is a critical signal of contrarian sharp betting. It often precedes profitable betting opportunities because it indicates sportsbooks are adjusting against the public to balance their exposure to professional action. A bettor who spots this pattern early can position on the sharp side before the line moves further.
| Scenario | Ticket % | Handle % | Signal |
|---|---|---|---|
| Public side dominates both | 70% | 68% | Pure public action, no sharp divergence |
| Public leads tickets, sharp leads handle | 70% | 45% | Sharp money on the other side |
| Reverse line movement | 70% tickets on Team A | Line moves toward Team A | Sharp money confirmed on Team B |
| Handle exceeds tickets on underdog | 35% tickets | 55% handle | Large professional wagers on underdog |
The table above shows that divergence scenarios carry the most strategic weight. A line moving against the public is not a mistake by the book. It is the book responding to information carried by large, professional wagers.
How can bettors use public betting percentages to improve their strategy?
Public betting percentages are a starting point. Professional bettors augment this data with line movement and closing line value (CLV) for better market timing and edge identification. CLV measures whether a bet placed earlier in the week was better than the line available at game time. Consistently beating the closing line is the strongest indicator of long-term betting skill.
A practical process for applying betting splits in decision-making:
- Check ticket volume. Identify which side the public is backing and by what margin.
- Compare handle percentages. Determine whether the money distribution matches or diverges from ticket distribution.
- Track line movement. Note whether the line is moving toward or away from the public side.
- Identify reverse line movement. If the line moves toward the heavily backed side, sharp money is likely on the other side.
- Assess closing line value. If you bet early, compare your number to the closing line to evaluate the quality of your decision.
- Use AI analytics. Tools like Chalkpicks' +EV Finder and line movement tracker process these signals in real time, reducing the manual work of cross-referencing multiple data sources.
Pro Tip: Relying solely on public percentages without checking line movement is the most common mistake at this level. The percentage tells you where the crowd is. The line tells you what the market actually believes.
Where to find reliable public betting percentage data
Quality public betting data requires two things: real-time updates and clear separation of ticket volume from handle. Many general sports news sites report only one figure, which limits their analytical value. Bettors need both metrics displayed together to spot divergence.
Key criteria for evaluating a betting data provider:
- Displays both "Bets %" and "Handle %" for each market
- Updates figures in real time or near real time as the market moves
- Covers multiple sports and leagues, not just major events
- Provides historical data for backtesting and trend analysis
- Pairs betting splits with line movement history
Combining public betting data with AI analytics enhances a bettor's ability to spot trends and act on them before lines adjust. Chalkpicks provides real-time odds comparison and line movement tracking designed to complement public betting insights. The platform's AI sports betting tools process thousands of data points, including public splits, to surface bets with positive expected value.
High volume bets show public sentiment but do not always indicate sharp money or value. Integrating handle percentages reveals a clearer picture of where professional bets actually sit.
Key Takeaways
Public betting percentages are most useful when ticket volume and handle are read together, not in isolation, because divergence between the two is where the sharpest market signals appear.
| Point | Details |
|---|---|
| Two metrics, not one | Always compare "Bets %" and "Handle %" together to get the full market picture. |
| Handle reveals sharp money | Large professional wagers inflate handle without moving ticket counts, signaling deliberate positioning. |
| Reverse line movement matters | A line moving toward the public side confirms sharp money is on the other side. |
| CLV validates decisions | Consistently beating the closing line is the strongest measure of long-term betting skill. |
| AI tools accelerate analysis | Platforms like Chalkpicks process public splits and line movement in real time to surface positive expected value bets. |
Why raw percentages alone have always been the wrong starting point
Bettors who focus only on ticket volume are reading the least informative half of the data. I have seen this pattern repeatedly: a bettor notices that 72% of tickets are on the favorite, fades the public, and loses. The problem is not the strategy. The problem is that they never checked the handle. The handle was also 70% on the favorite, meaning there was no divergence and no sharp signal. They were contrarian for no reason.
The more useful habit is treating public betting percentages as a filter, not a conclusion. When ticket volume and handle align, the market is in agreement and there is less edge to find. When they diverge, that gap is worth investigating further with line movement data and CLV. The Chalkpicks performance tracker shows this approach in practice, with documented results across thousands of picks.
Context also changes everything. A 65% public lean in an NFL divisional game carries different weight than the same figure in a mid-week international soccer match. Market liquidity, timing, and the sophistication of the typical bettor in that market all affect how much the public percentage actually means. Professional bettors delay betting until late in the market to maximize value, which means early-week percentages often reflect only casual money. The figures shift as game time approaches and sharps enter.
The discipline is in waiting for the full picture before acting.
— WTF69NEWS
Chalkpicks tools for reading betting market signals
Bettors who want to apply public betting splits without manually tracking multiple data sources have a direct option in Chalkpicks. The platform's neural network analyzes thousands of data points per game, including public percentages, line movement, and player-level statistics, to identify bets with positive expected value.

Chalkpicks' daily AI picks incorporate public betting data as one input among many, which is the correct way to use it. The Steam Move Detector alerts bettors to sudden line movements driven by sharp money, the exact signal that public splits alone cannot provide. With a verified 73.1% win rate and +18.4% average ROI, the platform gives bettors a structured, data-driven process for acting on market inefficiencies rather than chasing raw percentages.
FAQ
What are public betting percentages?
Public betting percentages show the share of total bets and total money wagered on each side of a sports market. They appear as two figures: ticket volume (Bets %) and money share (Handle %).
What is the difference between bets % and handle %?
Bets % counts the number of individual wagers regardless of size, while Handle % weights by dollar amount. A single $10,000 bet moves the handle far more than 100 bets of $10 each.
What does reverse line movement mean?
Reverse line movement occurs when the public heavily backs one side but the betting line moves toward that side rather than away from it. This signals that sharp bettors have placed large wagers on the other side, prompting the sportsbook to adjust.
How do I use public betting percentages to find value bets?
Compare ticket volume to handle percentages and look for divergence. When handle significantly exceeds ticket share on one side, large professional wagers are likely present. Pair this with line movement data and closing line value analysis for the clearest signal.
Are public betting percentages reliable on their own?
No. High ticket volume reflects public sentiment but does not confirm sharp money or market value. Reliable analysis requires combining ticket volume, handle percentages, line movement history, and tools like the Chalkpicks +EV Finder to identify genuine edges.